SMARTER 50K#
This is an attempt to test tstree with different 50K data. A single example of
50 samples is described in notebooks/03-smarter_database.ipynb. Here we want
to select different breeds from 50K and test how the tstree will results
import numpy as np
import pandas as pd
import seaborn as sns
import matplotlib.pyplot as plt

from tskitetude import get_data_dir
from tskitetude.smarterapi import SheepEndpoint
Collect all sheep samples from 50K:
sheep_api = SheepEndpoint()

data = sheep_api.get_samples(chip_name="IlluminaOvineSNP50")
page = page = data["page"]
sheep = pd.DataFrame(data["items"])

while data["next"] is not None:
    data = sheep_api.get_samples(page=page+1, _type="background")
    df_page = pd.DataFrame(data["items"])
    page = data["page"]
    sheep = pd.concat([sheep, df_page], ignore_index=True)

sheep.info()
<class 'pandas.core.frame.DataFrame'>
RangeIndex: 5892 entries, 0 to 5891
Data columns (total 17 columns):
 #   Column       Non-Null Count  Dtype
---  ------       --------------  -----
 0   _id          5892 non-null   object
 1   breed        5892 non-null   object
 2   breed_code   5892 non-null   object
 3   chip_name    5892 non-null   object
 4   country      5892 non-null   object
 5   dataset_id   5892 non-null   object
 6   locations    4849 non-null   object
 7   metadata     4878 non-null   object
 8   original_id  5892 non-null   object
 9   phenotype    577 non-null    object
 10  smarter_id   5892 non-null   object
 11  species      5892 non-null   object
 12  type         5892 non-null   object
 13  father_id    58 non-null     object
 14  mother_id    58 non-null     object
 15  sex          501 non-null    float64
 16  alias        156 non-null    object
dtypes: float64(1), object(16)
memory usage: 782.7+ KB
Count how many samples I have by breed:
sheep_count = sheep.groupby('breed_code').size().reset_index(name='count')
sheep_count
| breed_code | count | |
|---|---|---|
| 0 | AAW | 24 |
| 1 | ADP | 21 |
| 2 | AFS | 37 |
| 3 | AIM | 88 |
| 4 | ALP | 24 |
| ... | ... | ... |
| 204 | WIL | 23 |
| 205 | WMH | 24 |
| 206 | XIS | 24 |
| 207 | ZEL | 24 |
| 208 | ZUJ | 5 |
209 rows × 2 columns
Plot count distribution:
fig, ax = plt.subplots(figsize=(12, 6))
sns.histplot(data=sheep_count, x='count', kde=True, binwidth=10, ax=ax)
plt.show()
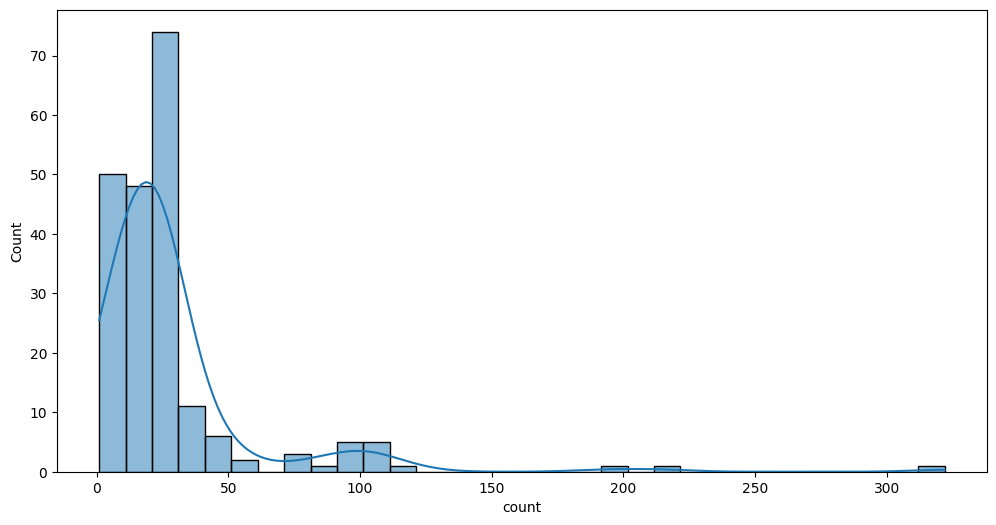
The majority of the breed have <= 50 samples. Try to focus to the higher column, for example where counts > 20 and <=30:
selected = sheep_count[(sheep_count['count'] <= 30) & (sheep_count['count'] > 20)]
print(f"There are {selected['count'].shape[0]} breeds having samples between 20 and 30")
There are 84 breeds having samples between 20 and 30
Now extract randomly a certain number of breeds and make a CSV file that I can use
to extract genotypes using nf-treeseq pipeline:
np.random.seed(42)
repeats = 5
breed_size = [1, 2, 5, 10, 15, 20]

for i in breed_size:
    for j in range(repeats):
        sample = selected['breed_code'].sample(n=i, replace=False)
        filename = f"{i}_breeds-{j}-50K.csv"
        sample_df = sheep[sheep['breed_code'].isin(sample)]
        sample_df[["breed_code", "smarter_id"]].to_csv(get_data_dir() / filename, index=False, header=False, sep="\t")